How to debug client-side JavaScript with the Jetbrains debugger
21 August 2022 (Updated 13 January 2023)
Note: these instructions are mainly for myself. To avoid wasting your time, I suggest you refer to the official Jetbrains docs.
Make sure plugins are installed
If you’re not using Webstorm, make sure you’ve installed and enabled a few plugins.
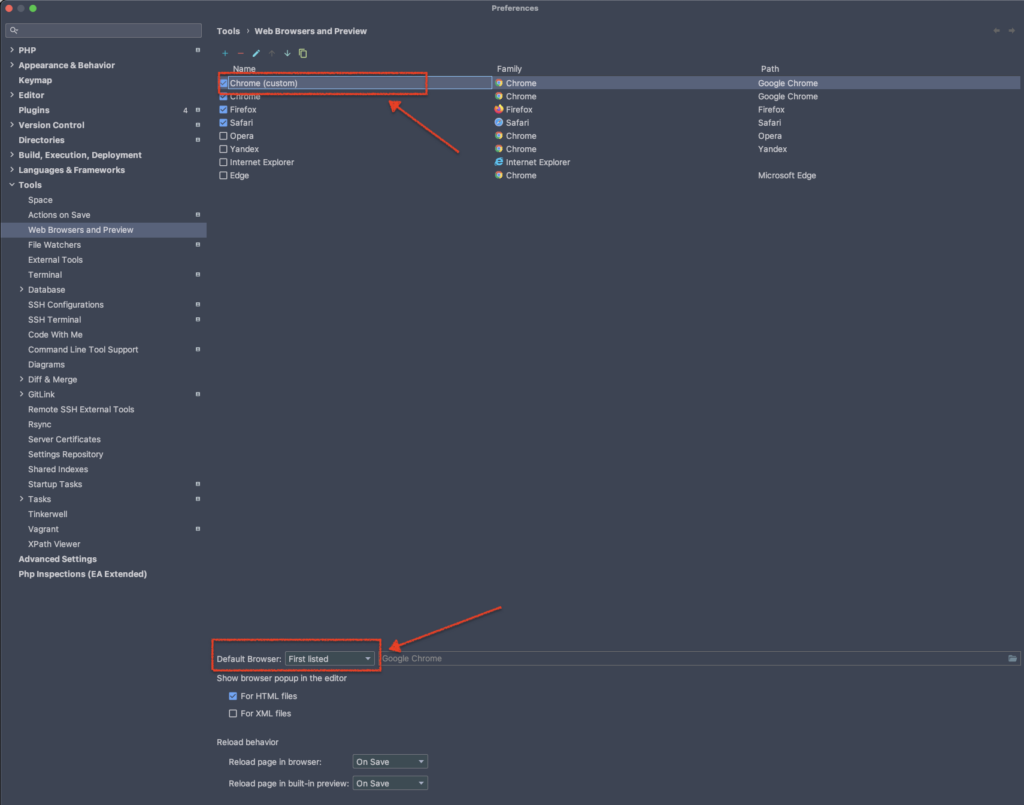
Configure Chrome to start with Chrome user data

Make sure your new custom browser is at the top of the list and you’ve selected First listed for the Default Browser field.
Close Chrome window
The first time you start the debugger, you’ll need to close any opened Chrome window. On macOS, open your Chrome window and press Cmd + q.
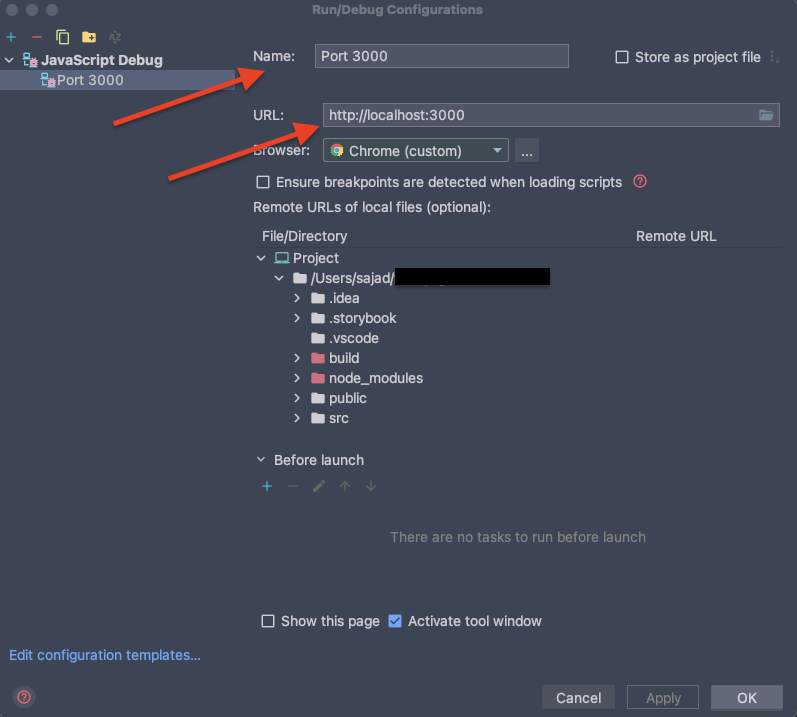
Create Debug configuration
- In the IDE, select
Run > Edit configurations... - Add new config
- Name it something like
Port 3000 - Add the URL that your app will be running on (e.g.,
http://localhost:3000 - Click
Okto save config.
- Name it something like

Configure ignore list

Start the debugger
Set one or more breakpoints, select Run > Debug... and select your previously created debug config.
Troubleshooting
- Make sure details source maps are generated. Use Vite if you can. I think create-react-app doesn’t generate very good source maps by default so you might need to configure it.