Useful Chrome DevTools features
Use DOM breakpoints
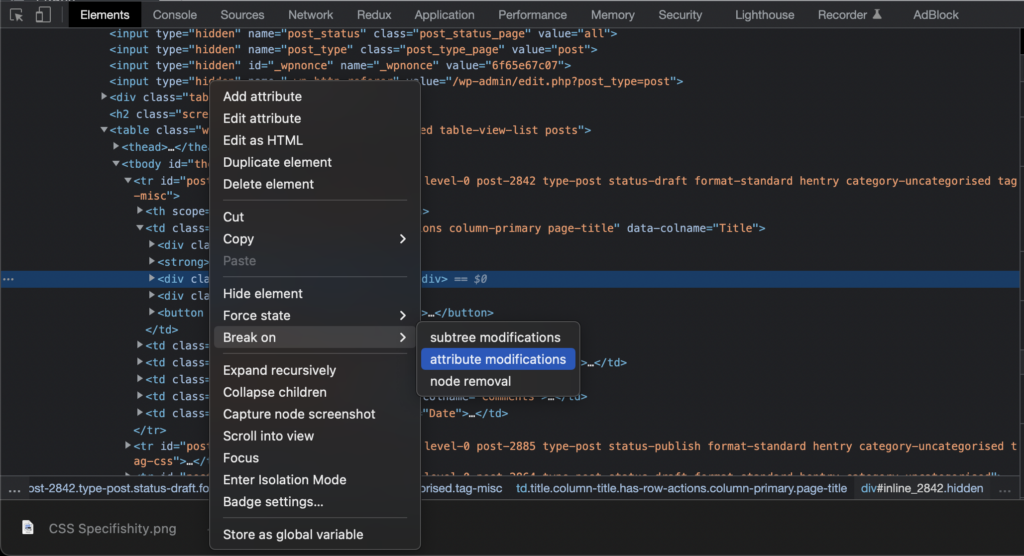
DOM breakpoints can be used to set breakpoints on:
- Attribute modifications: find out what code is changing an attribute (e.g., class, id,
data-*, etc). - Subtree modifications: find out what code is changing nodes within the element.
- Node removal: find out what code is removing a node.
To set DOM breakpoints, right-click on an element in the Elements tab and select a breakpoint trigger:
You can also utilize many other debugging functionalities.
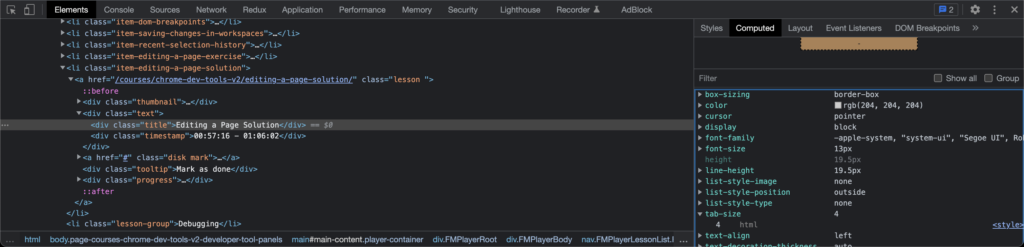
Use the computed styles tab
- Select an element in the Elements tab or using
Cmd + Shift + C. - Open the Computed tab from the right.
- This will show all the styles that have been applied to the element.
- Hover over a style line (e.g.,
background-color: blue) and click on the small arrow icon that appears just before the style line. - That will take you to the source of the style.
Use live expressions to keep track of changes
You can use live expressions to watch how the value of an expression changes in real time. For example, you might want to watch the value of a myForm.state object as you interact with a form.
Scroll element into view
Select an element in the Elements tab, and select Scroll into view.
Make element invisible
Select an element in the Elements tab, and press H.
Delete element
Select an element in the Elements tab, and press Delete / Backspace. Undo with Cmd + / Ctrl + Z.
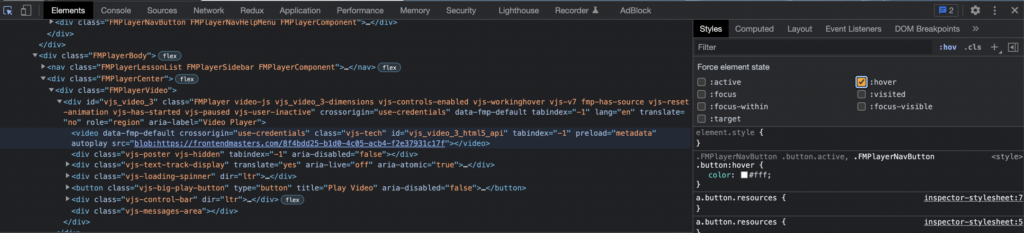
Force element state
Toggle colour format
Hold shift and click on the colour square next to a colour rule. This will toggle between different colour formats – RGB, HEX, and HSL. This can be very useful if a CSS variable is being used (e.g., var(--wp-admin-theme-color) and you want to see the colour in HEX or RGB.
Use jQuery-like selectors
In the Console, you can select elements like so:
$('nav')
$('nav li')
Use the Command palette
Use Cmd + Shift + P to use the command palette and do things quickly.