Chrome DevTools debugging reference
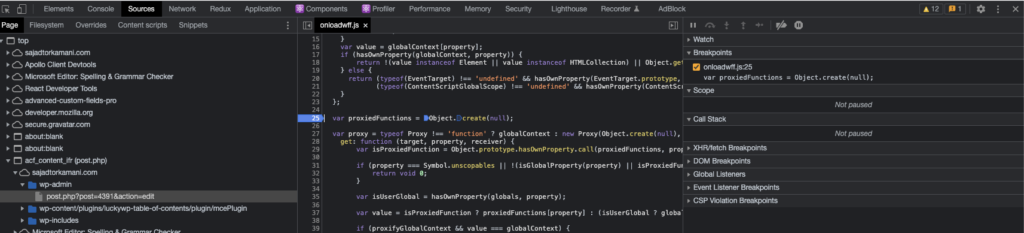
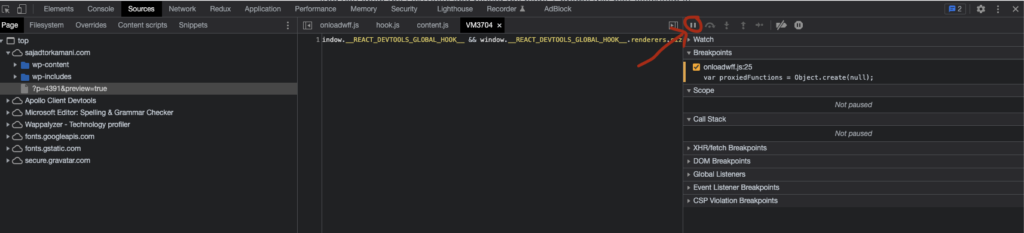
Set a breakpoint using DevTools
Open the Chrome DevTools (Cmd + Shift + I).
Go the Sources tab and locate a JavaScript file.
Click on a line number. The line number should become highlighted in blue.
Reload the page and Chrome will halt execution when it reaches your breakpoint.
Similar approach should work for other browsers.
Set a breakpoint using the debugger statement
You can insert the debugger statement anywhere in your source code and Chrome DevTools (or any available debugger in the current JavaScript environment) will break just before that line. DevTools must be open for the breakpoint to be triggered.
For example, if you load a script in Chrome with the following JavaScript code:
console.log('hey')
debugger;
console.log('hello')
And you open the DevTools and reload the page, Chrome will halt execution at line two.
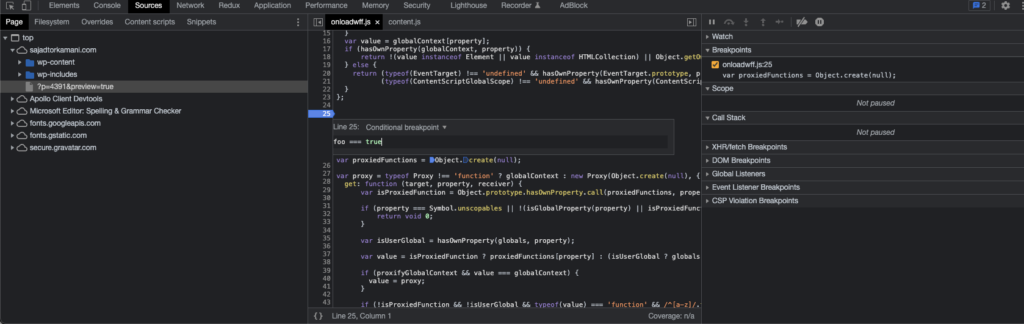
Set conditional breakpoints
Set a breakpoint at any line.
Right click the breakpoint (works in Chrome and Jetbrains IDEs) and click Edit breakpoint.
Enter a condition / expression that must evaluate to true for the breakpoint to be triggered.
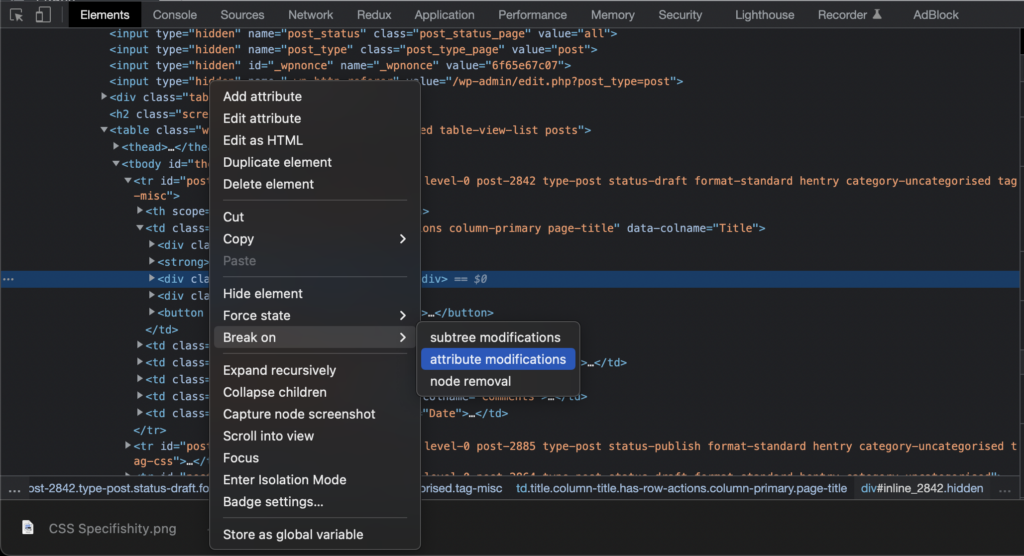
Set DOM breakpoints
DOM breakpoints can be used to set breakpoints on:
- Attribute modifications: find out what code is changing an attribute (e.g., class, id,
data-*, etc). - Subtree modifications: find out what code is changing nodes within the element.
- Node removal: find out what code is removing a node.
To set DOM breakpoints, right-click on an element in the Elements tab and select a breakpoint trigger:
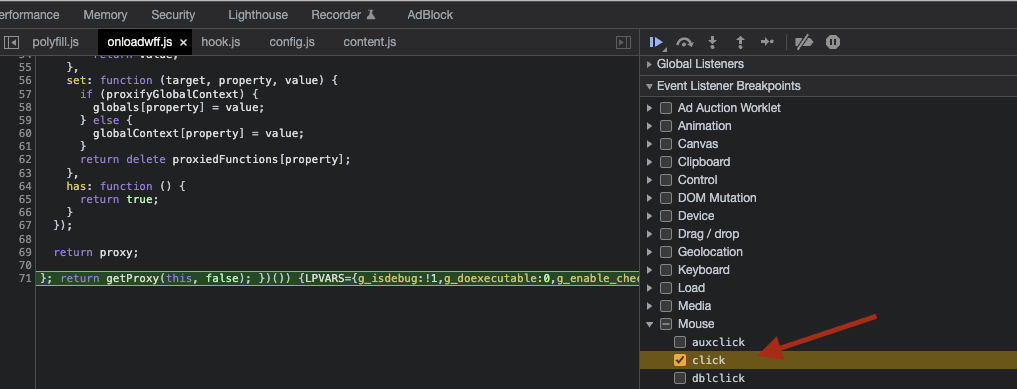
Set event listener breakpoints
Event listener breakpoints halt execution whenever a particular event fires (e.g., click, keypress, readystatechange, setInterval, etc).
Pause on any JavaScript code
Halt execution as soon as any JavaScript is executed.
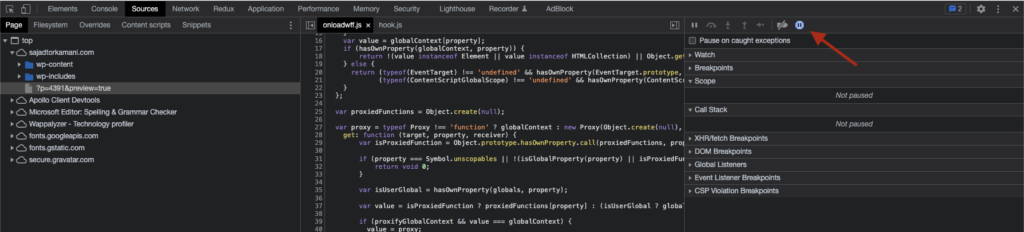
Pause on uncaught exceptions
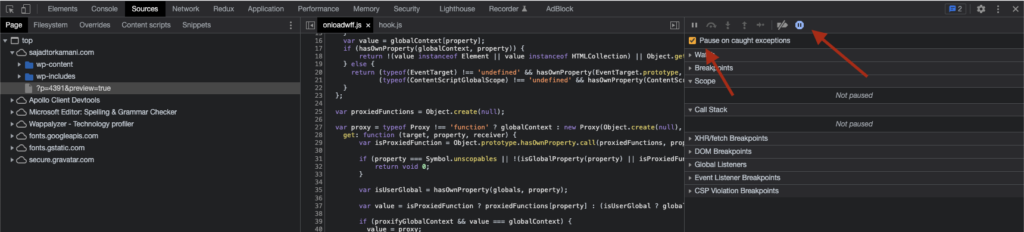
Pause on all exceptions
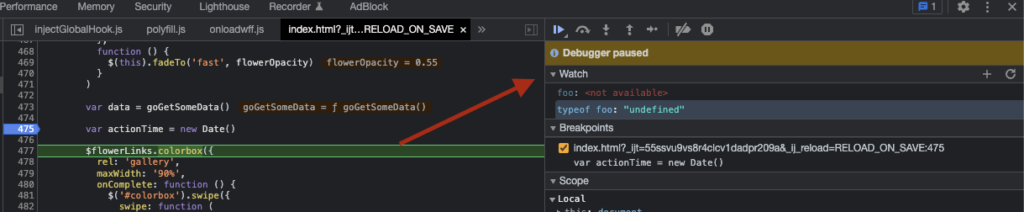
Watch the values of variables / expressions
You can add variables or expressions (e.g., typeof myVar, foo.bar, someFunction()) to a watch list and then watch the value change as you step through your code. This is useful when you’re trying to figure out how a variable’s value changes as your code is executed.
Step through code
Step over next function call
Step over the next function call without pausing inside any nested functions.
Step into next function call
Step into the next function call and recursively into any nested functions.
Step out of current function
Step out of the current function. Useful when you want to step back up the call stack.
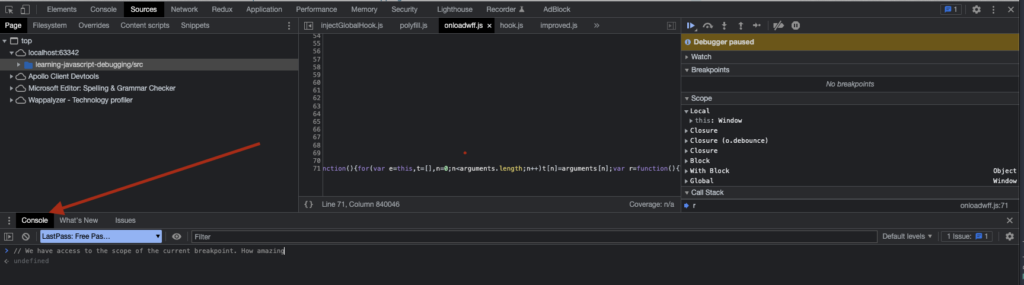
Open interactive console at any breakpoint
Press Esc to open the interactive console at any breakpoint. You will have access to the scope of the current breakpoint.
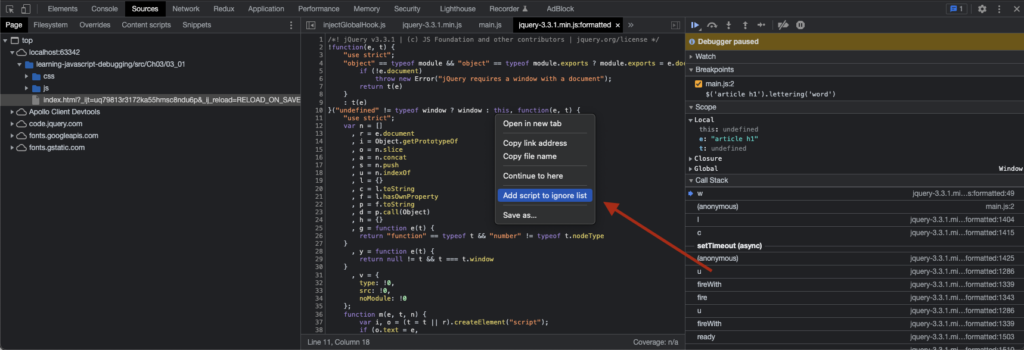
Add scripts to ignore list
You can tell Chrome DevTools to ignore / black-box certain scripts when stepping through code. This is useful when you’re confident that a bug doesn’t lie in a certain third-party library (e.g., jQuery) and so you don’t want the debugger to step through its code.
To black box a script, open up the script in the Sources panel, right-click anywhere inside the file, and choose Add script to ignore list.
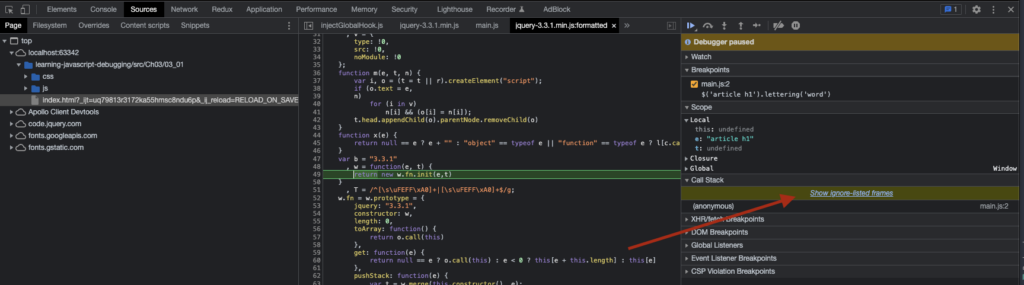
After you’ve black-boxed a script, its frames won’t show up in the call stack. Instead, you’ll see a Show ignore-listed frames button:
Other notes
- What is a debugger?
- Execution pauses just before your breakpoint.
- You can toggle breakpoints to enable / disable them individually. You can also enable / disable all breakpoints.